 United States
 United Kingdom
 Canada
 South Africa
 Australia
Selling Bitcoins – When Is The Best Time to Sell Bitcoins?

A person who had invested $100 in Bitcoin (BTC) in January would have seen it more than quadruple by June 2019.
However, Bitcoin, which underwent a correction last weekend, has put so many investors in dilemma: “Should they sell their entire holdings or portion of their holdings leave it as it is hoping that the recent decline is only a temporary price correction“.
While there are pessimists who continue to argue that Bitcoin is simply a speculative asset with no real value, it should be noted that the resilience of Bitcoin and other major cryptocurrencies are directly related to do with the real world volatility.
So, a crypto investor would be obviously worried when to book profit in cryptocurrency market and Bitcoin in particular. The worries get amplified by the velocity at which Bitcoin rises and falls every time, giving less time for even established traders to make a right decision. Often, the thought of making a wrong decision stops timely exits.
So, in this article let us try to find out a solution to the Bitcoin exit or profit booking issue.
Cryptocurrency Exchanges Where to Buy Bitcoin
Selling Bitcoin
As the value of Bitcoin has been increasing massively, you may get tempted to sell your holdings for cash. However, when you do choose to sell Bitcoin, try not to jump the gun as you could miss out even bigger payday!
People who have never have sold Bitcoin before may find it confusing, but as long as you have access to a digital currency exchange or a Bitcoin ATM, you will always have plenty of ways to turn Bitcoin into a fiat currency.
Low Transaction Fees
If you have been using Bitcoin as a way of investing and earning money, then you may wish to minimize the fees and charges taken by the exchange while booking your profit.
To do so, you may have to carefully pick the crypto exchange you use to sell your Bitcoin or else you may end up losing a good portion of your profit in the form of fees paid to the exchange.
Fast Payouts
The payout time may vary depending on the mode of payment used. Thus, it is quite important to choose a payment mode, which allows quick encashment after selling the crypto currency.
Person to Person Exchanges
Keep in mind, the best way to reduce the fees and charges while selling Bitcoin will be to sell it to another user of Bitcoin that you know and trust. You can send the Bitcoin to counter party’s digital wallet and receive payment in cash through a spot transaction.
The temptation for you to sell Bitcoin, despite the quantity you have in your wallet, will be too much to bear, when the price of Bitcoin rises sharply. Alternatively, there will be people who will sell their holdings at a loss when the crypto currency undergoes a price correction.
With all of that in mind, you need to remain firm while trading Bitcoin and be prepared to see its value rise and fall often.
If you do want to sell Bitcoin, then ensure that you are going to get the best exchange rate possible. That can be done by trading in a Bitcoin currency exchange which charges nominal fees. Ironically, the fees in most exchanges are high.
Option I: Exit based on personal targets
Most investors will certainly have a target price in mind. The reason may be related to technical, fundamentals or even based on general opinion in social media platforms. Furthermore, personal needs or plans may also make an investor believe that a particular price would be enough to achieve short-term or medium-term objectives. For example, an investor may be extremely happy to exit with 10x returns. Another may not be satisfied even with 20x returns. Almost a majority of crypto investors fall in this category. In most cases, any of the two scenarios are possible after they sell their holdings.
Scenario One: Hold Bitcoin and see it plunge from $13,000 to $3000.
Scenario Two: Sell Bitcoin and see it rally to over $20,000 soon.
Ideally, an investor would like to book profit near the peak, which is quite difficult to predict. Given the windfall gain, there is a middle option available to such crypto investors.
When the value of Bitcoin hits 4-6 times the investment, try offloading 20% to 30% of holdings. If the crypto declines sharply then there won’t be any regret. If it rises further, still, the investor can watch the rally without any guilty feeling. This system ensures that an investor will make a decent profit and money related worries are substantially eliminated. The system also balances potential gains from possible losses.
Option II: Exit based on technical indicators
Professional traders mostly opt for a combination of technical and fundamental factors, in addition to overall market sentiment to decide an entry or exit from a trade.
While there are practically 1000s of technical indicators, the most popular ones among experienced traders are stochastics, Relative strength index (RSI), Moving Average Convergence Divergence (MACD) and momentum. These indicators are used individually or in combination along with support and resistance levels to decide an entry or exit.
Traders also use either or both 50-day and 200-day moving average to quickly understand the overall price trend. When the short-term moving average (50-day) crosses above the long-term (200-day) moving average, it is construed as a buy signal, and vice versa.
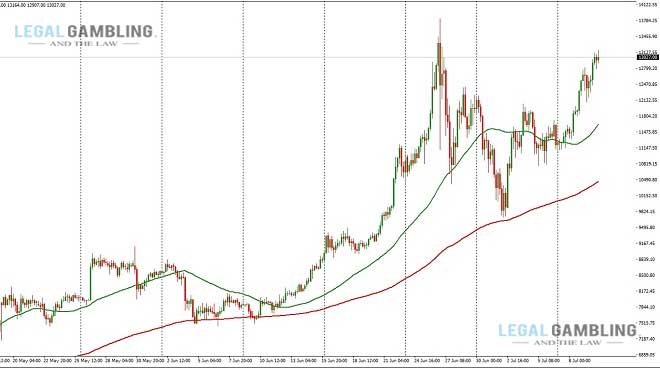
The image above shows the 50-day moving average (green) remains above 200-day moving average (red) for the past three months.
So, a Bitcoin trader should continue to hold without despite the volatility.
To confirm the trend any of the momentum indicators mentioned above are used. For example, a stochastic indicator should be rising when there the moving averages have made a bullish cross over. It should be remembered that all the indicators and even moving averages are lagging indicators i.e., they follow the price movement and not otherwise. To minimize price lag, traders general prefer to use an exponential moving average. It should be remembered that attempts to reduce the lag in a big way would result in frequent entries and exits as noise (small price movements) will not get filtered.
The smartness of a trader lies in interpreting these signals precisely as all indicators have some disadvantages. For example, a stochastic indicator with a reading of over 80 indicates an overbought scenario. However, if the indicator does not fall below 80 then the price would continue to rise and selling Bitcoin at that time will be a bad idea.
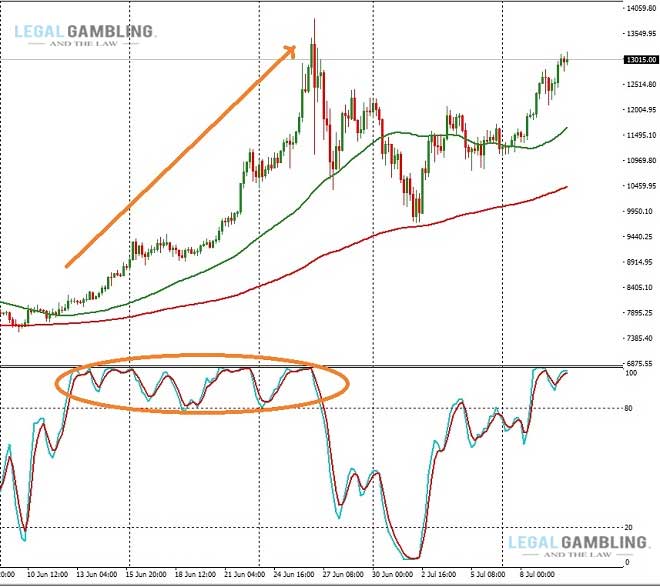
The image above shows clearly that the price of Bitcoin had appreciated even when the stochastic indicator is in the overbought region.
A trader should remember not to sell his holding before the stochastic indicator falls below the reading of 80.
Likewise, if the stochastic indicator has a reading below 20 and the price is trading below 200-day moving average then a rebound will be short-lived. On the other hand, if the price is above 200-day moving average (as in the image above) then we can expect further appreciation in price.
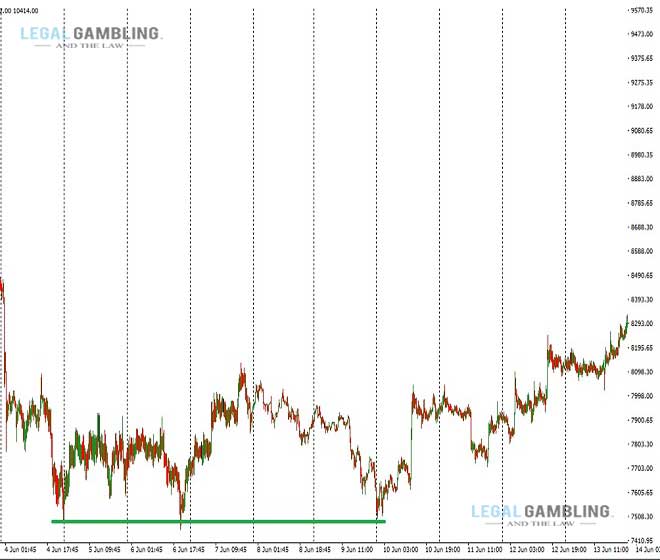
Along with moving averages and a momentum indicator, professionals also use resistance and support levels.
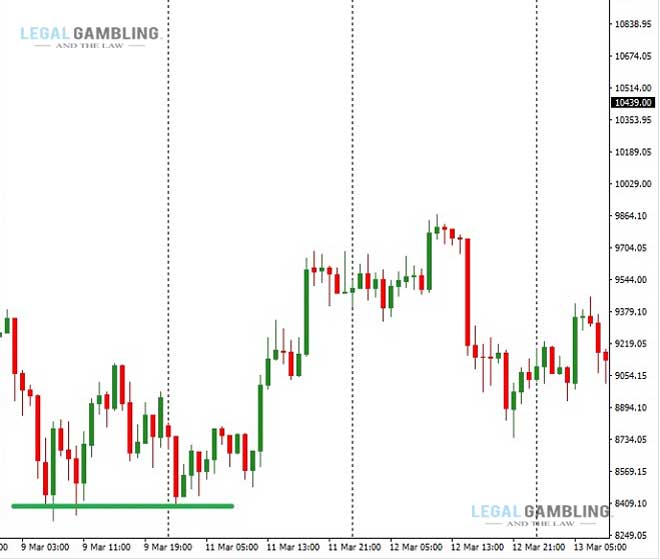
In the below diagram, when we use resistance and support levels, decisions can be taken in a better manner.
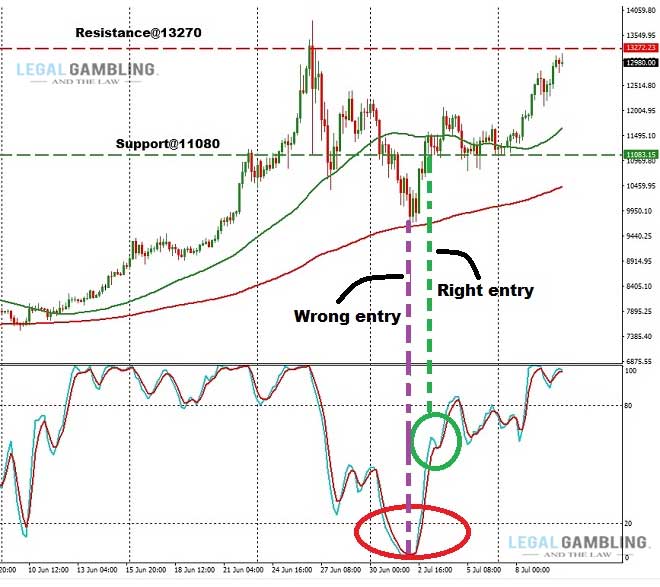
The green circle indicates the point where support levels have been tested and stochastic indicator is rising. That would be the best entry point with minimum risk. When the stochastic indicator is below the reading of 20, the price has broken the support level temporarily. So, even though stochastic indicator confirms an oversold scenario long positions should be avoided. The inverse is true for booking a profit in Bitcoin trade.
Option III: Exit based on stock chart patterns
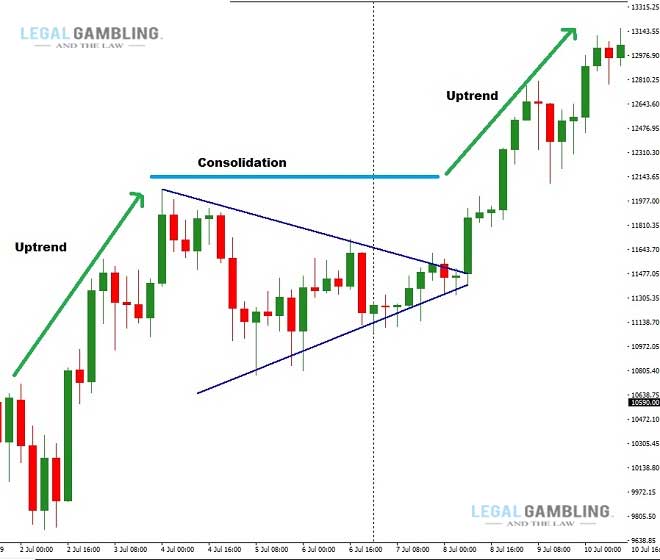
Price volatility leads to formation of repetitive patterns in financial markets. Such price patterns can be identified using trend lines. When a price pattern indicates a change in trend, it is called as reversal pattern. Alternatively, when a price pattern signals a continuation of prevailing trend, it is called as continuation pattern.
Price patterns are frequently formed in all time frames (intra-day, daily, weekly and monthly). As human beings unconsciously repeat their past behaviour, patterns get repeated on charts. By identifying those patterns, a trader can enter or exit the position before the break out actually happens.
Popular continuation patterns
Bitcoin has formed several continuation and reversal patterns in the past as illustrated below:
Pennants – it is drawn using two converging trendlines, which are moving in different directions (up trendline and down trendline).
Flags – it is drawn using two parallel trendlines, which can stay flat, slope up or slope down.
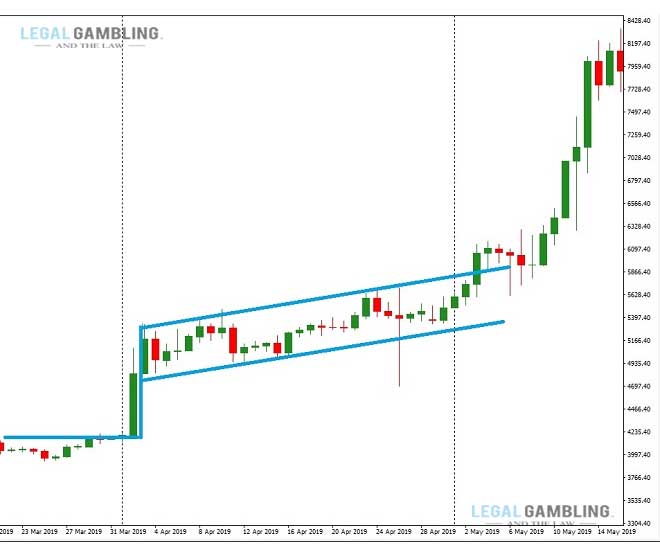
Wedges – it is drawn with two converging trendlines, which are angled either up or down. Unlike a pennant, both trendlines point to the same direction in a wedge pattern.
Reversal Patterns
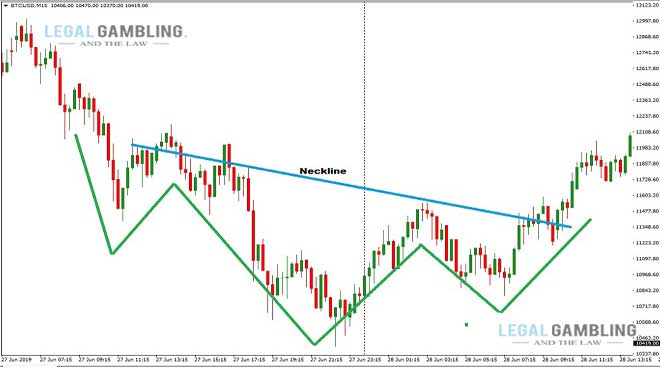
Head and Shoulders – it appears at market tops. The pattern is made up of an initial peak, followed by a bigger one. The final peak mimics the first. Price reversal is confirmed once the neckline is broken. Inverse head and shoulders results in a bullish break out.
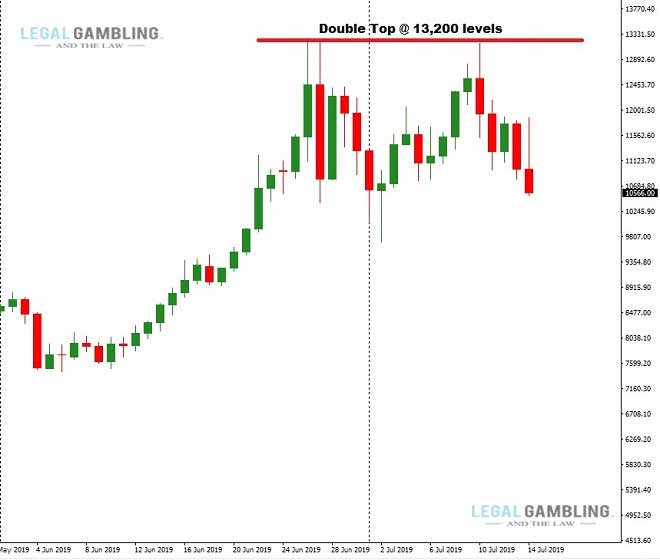
Double Tops – Two unsuccessful attempts to break a price level (resistance) results in the formation of a double top pattern, which looks like alphabet ‘M’.
Double Bottoms – Two unsuccessful attempts to break a price level (support) results in the formation of a double bottom pattern, which often looks like alphabet ‘W’.
Cup & handle – It resembes u-shape, with the handle sloping downwards. The pattern can last between seven weeks and roughly 65 weeks.
Ascending triangle – This pattern is seen during an upward trend and is regarded as a bullish continuation pattern. Rarely, it can be formed as a trend reversal pattern at the end of a downward trend. Irrespective of where they occur, the pattern indicates bullishness.
Descending triangle – This pattern is seen during a downward trend and is regarded as a bearish continuation pattern. Rarely, it can be formed as a trend reversal pattern at the end of an upward trend. Irrespective of where they occur, the pattern indicates bearishness.
Triple bottom – This pattern is formed after a long downward trend and indicates trend reversal.
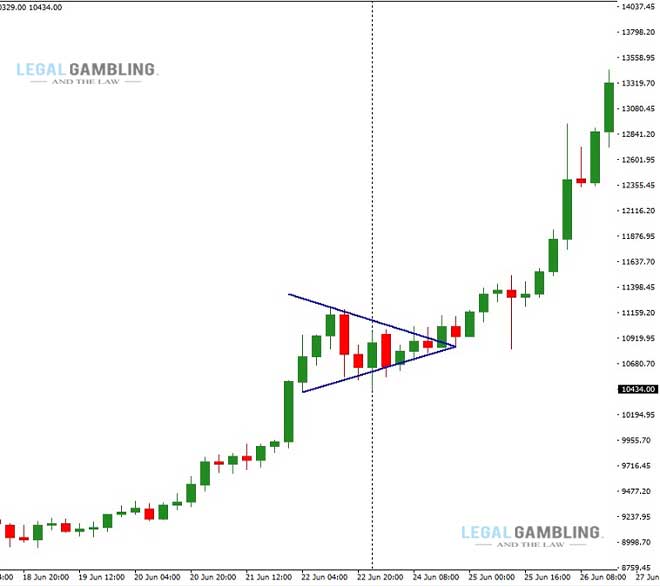
Bullish symmetrical triangle – The symmetrical triangle pattern is made up of a unique shape created by convergence of two trend lines.
Bearish symmetrical triangle – It is similar to bullish symmetrical triangle, but the lower trend line is broken by selling pressure.
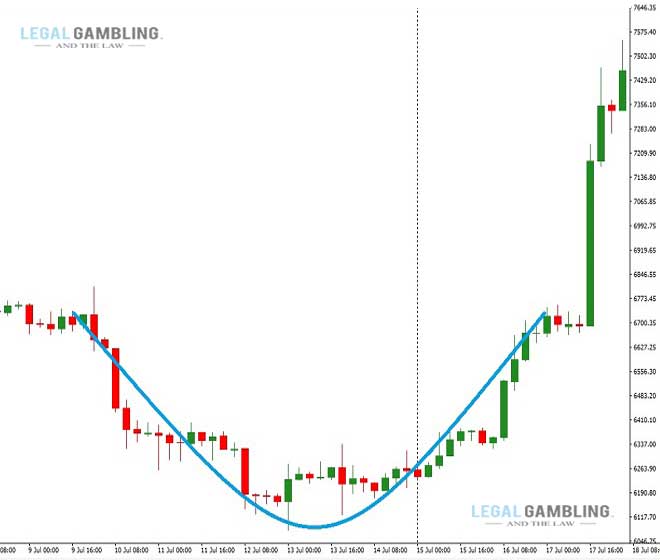
Rounding bottom – The pattern is also referred to as a “saucer bottom”, indicating a long-term (last between several months and years) bullish reversal.
By learning to identify a price pattern, a trader will be able to exit a Bitcoin trade without any dilemma.
Option IV: Exit based on harmonic patterns
Harmonic price patterns are a better way of identifying trend reversals by applying Fibonacci ratios to geometric price patterns. Most importantly, harmonic patterns enable a trader to forecast future price movements.
Harmonic pattern trading involves three kinds of ratios:
- Primary Ratios
Calculated from the Fibonacci number series:
0.618 = Primary Ratio
1.618 = Primary Projection - Primary Derived Ratios
0.786 = Square root of 0.618
0.886 = Fourth roof of 0.618 or Square root of 0.786
1.130 = Fourth root of 1.618 or Square root of 1.27
1.270 = Square root of 1.618 - Complementary Derived Ratios
0.382 = (1 – 0.618) or 0.618e2
0.500 = 0.770e2
0.707 = Square root of 0.50
1.410 = Square root of 2.0
2.000 = 1 + 1
2.240 = Square root of 5
2.618 = 1.618e2
3.141 = Pi
3.618 = 1 + 2.618
Types of Harmonic Patterns
- AB=CD Pattern
- The Gartley
- The Butterfly
- The Bat
- The Crab
- The Cypher Pattern
- The Shark Pattern
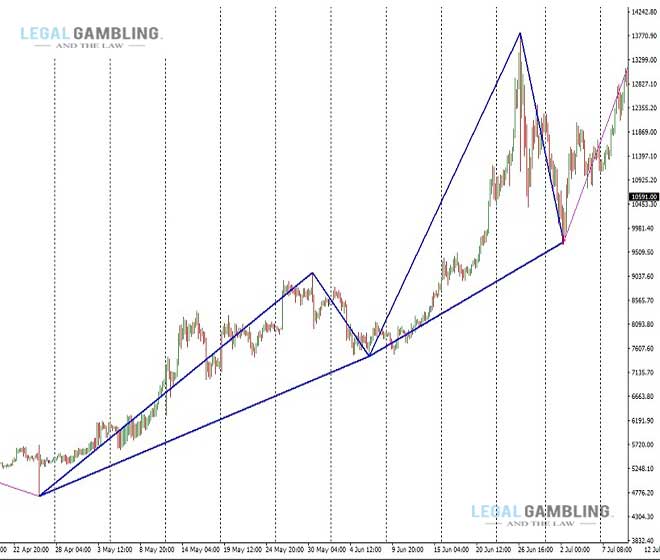
- The Swan pattern – the image below shows the bullish swan pattern recently formed by Bitcoin.

Option V: Exit based on unique price history
For a variety of reasons, Bitcoin tends to remain in a downtrend or uptrend on specific months of a year. Even though there is no guarantee that it will happen again next year, still, it allows a trader to exit before the cryptocurrency drops sharply. For the past several years, Bitcoin either trades flat or falls sharply in January of every year. In 2015 and 2016, the crypto lost 12.7% and 27.3%, respectively. In 2018, however, Bitcoin traded almost flat (+0.51% gain). Using an excel sheet, a trader can identify such characteristics and use it for selling at the right time.
Interestingly, Harvard researchers have found that there is a 50% probability of a price correction to happen after an asset rallies by more than 100% over a period of two years. The probability of a crash increases to 80% if the asset price increases by a minimum of 150%. The researchers arrived at the conclusion after studying nearly a 100-year data in several financial markets across the world. So, a trader can use the conclusions to make an exit at the right time.
Conclusion
It is impossible to accurately predict a rally or price correction in Bitcoin, as there are several factors which influences its rise and fall. Thus, it is necessary to act quickly after deciding to buy or sell Bitcoin, as the price may not remain near the desired levels for a long time. The fees charged by a crypto currency exchange also determine the final yield from a Bitcoin trade.
Frequently Asked Questions
There is much more to Bitcoin than simply knowing the best time to buy or sell it. Therefore, I will now move onto answering some of the questions you may have about using that cryptocurrency.
Should I invest in Bitcoin?
Are digital currency start ups worth investing in?
Can I send Bitcoin to anyone?
What exactly does a Bitcoin look like?
Further Reading
I would like to point out that I have compiled several additional articles and guides related to Bitcoin. I feel you may enjoy reading it in this website.
So, please do spend as much time as you like looking around this site. A couple of articles that I would like to recommend for reading are “How do I Send Bitcoin” and “Can Anyone Buy Bitcoin”.